You can execute performance tests on your app or website by running JMeter scripts in Load Test. Load Test enables you to run one or more JMeter scripts in a single test from the UI and provides a holistic view of test stats together with server-side monitoring and many more unique features. This document describes how to upload and run JMeter scripts in Load Test.
To run JMeter scripts in Load Test, you need to perform the following:
- Upload JMeter scripts.
- Select locations where you want to generate the load.
- Run and analyze results.
Pre-Requisites
Before uploading JMeter scripts in Load Test:
- Create JMeter scripts and save them on your machine in a ZIP format. While uploading a new script, zip your JMX file including any CSV data set, dependent JMX files, or additional plugins with the same name as your JMX name.
Run JMeter Scripts
Script Selection
- Expand the menu icon and select Scripts > Run JMeterScripts on the Load Test home page as shown in below figure.
2. The Run JMeter Scripts window is displayed on Load Test as shown in below figure.
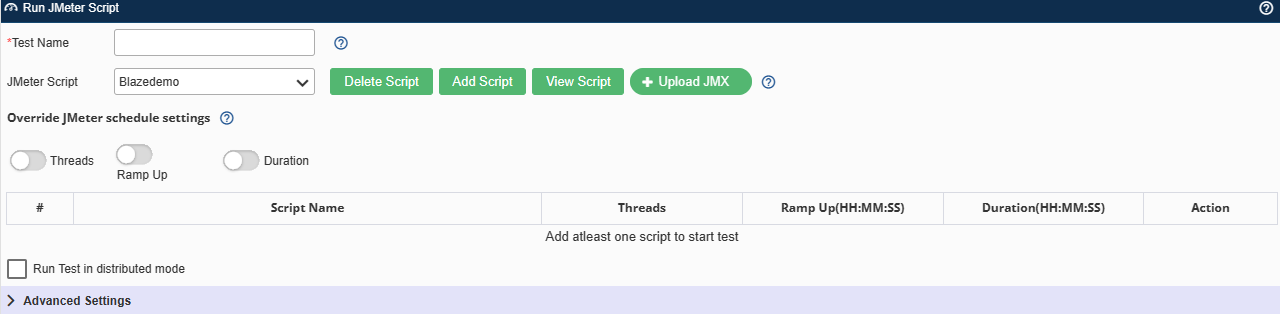
3. Specify your Test Name. Do not use more than 64 characters, the first character must be alpha, and other characters can include alpha, numeric, or underscore.
4. Select an existing script from the JMeter Scripts drop-down list, or Upload a new script:
- Click the Upload
- Browse to the new JMX/Zip file having dependent resources.ZIP your JMX file including any CSV data set, dependent JMX files or additional plugins. All CSV data files and other dependent JMX must not use absolute path.
Note: After you have uploaded a JMeter script, the script will be available in the JMeter Script drop-down list next time.
5. Override the JMeter settings by enabling Threads, Duration, or Ramp Up It is optional to overwrite these settings. (Refer to Section A).
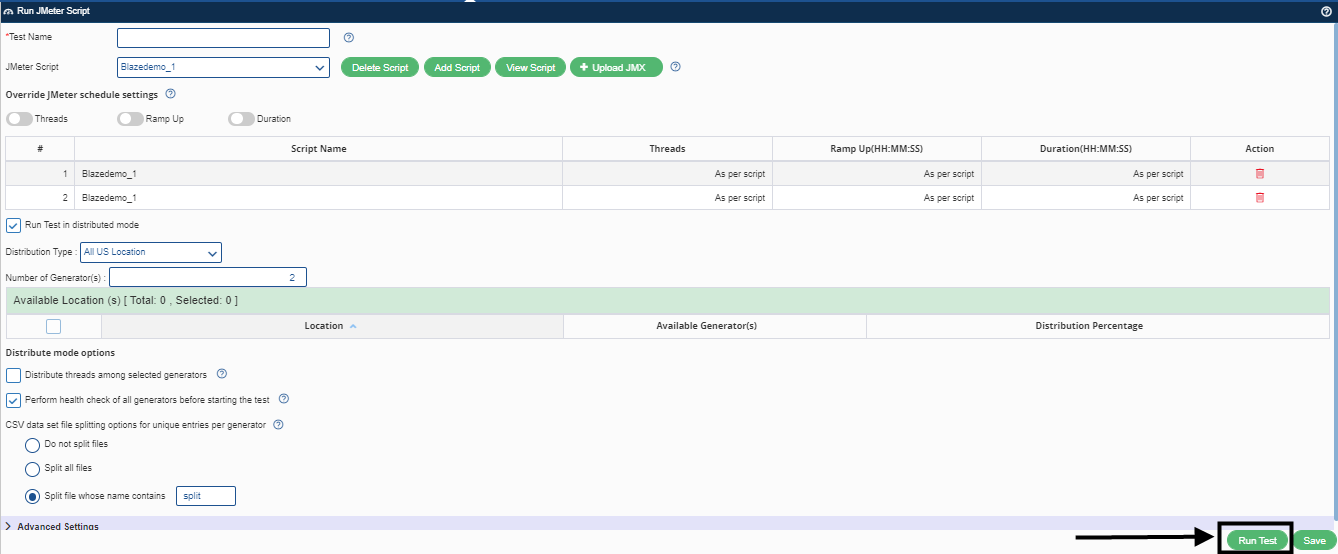
6. Click Add Scriptto add the script. You can add multiple scripts. To remove a script, click the delete icon in the Action column.
Set Distributed Mode
If you want to run a test from more than one location, you can run the test in the Distributed mode. In this mode, you can select multiple generators and distribute the load among generators.
Select the Run test in distributed mode check box, and then select one or more generator(s).
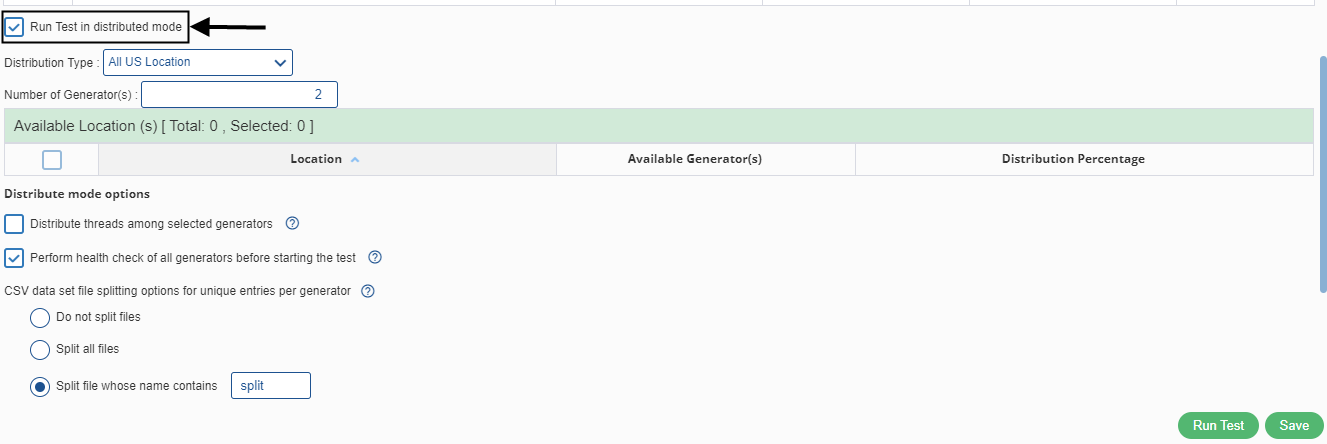
- Distribute Threads among different generators: Select the Distribute threads among selected generators check box to divide threads equally among all generators otherwise, all generators will run total threads. For example, if there are 1000 threads and 10 generators, each generator will run 100 threads. If the distribution is not enabled, then each generator will run 1000 threads.
Note: This mode cannot be used if you are parametrizing threads count.
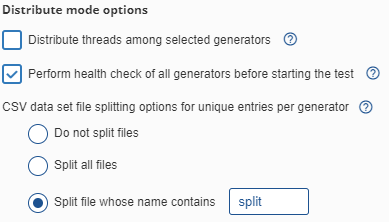
- Perform Health Check of All Generators Option: By default, the health check option is enabled, where CPU, memory, and disk availability checks are performed before starting the test. If you are running a debug test, you can disable the health check.
- CSV Data Set File Splitting Options: You can split files with unique entries per JMeter instance using the CSV File Split options. Splitting is done based on the number of generators, which means that you are equally dividing the number of data lines among generators.You can use the following splitting options:
- Split all files: Using this option, you can split all the files.
- Split file whose file name contains ‘<specified text >‘: For example, there are two data files – ProducID.csv and Login_split.csv, and if you want to split only Login_spilt.csv then you can, you can use ‘split’ as specified text and it will split only Login_split.csv.
- Do not split: Using this option, you can prevent splitting files.
Note:
- If splitting is to be done, the file name must not contain any variable name.
- Files must have data lines greater than or equal to the number of generators.
Run Test
You are now ready to run your test. Click the Run test button to start your test.
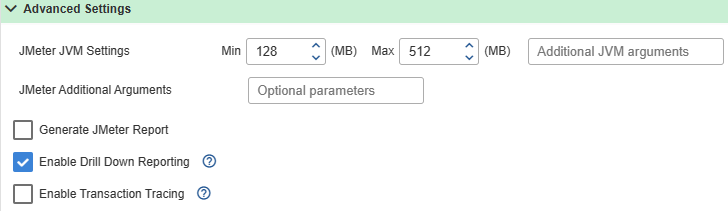
To set additional parameters, expand the Advanced Settings section:
- Jmeter JVM Settings: You can overwrite the minimum and maximum heap size values in MB.
- Optional Parameters: You can overwrite JMeter and Java properties in the Optional parameters field: -J< key >= < value > for JMeter and -D< key >= < value > for Java.
Example:
If you have a variable named as loopCount in the JMeter script and you want to set it at the start of your test, use the following format:
-JloopCount=5
Similarly, for –D, specify the following code in the Optional Parameters field:
-DloopCount=5
- Drill Down Reporting: Drill-down reporting helps in the analysis of transactions and view of all individual transaction start time, duration, HTTP status code, etc. To enable this option, select the check box Enable Drill Down Reporting.
- Transaction Tracing: Transaction tracing helps in verification of transactions while developing your script or debugging of failed transaction in a performance test. You can view request and response in real time while test is running or later after test is over. It is recommended to limit trace to 1% in case of performance test. To enable this option, select the check box Enable Transaction Tracingand select the further options as required.
Tip:
- Every thread in a JMeter script is called a virtual user.
- URLs are HTTP samples executed by virtual users.
- Pages consists of one or more URL in the context of the same sampler. For example, if an embedded resource is enabled, then one page will have many URL records.
- Transactions are the same as Transaction Controller. One transaction will have one or more pages if ‘Generate Parent Sample’ is enabled in the transaction controller.
- A session (iteration) of a virtual user is a group of samples executed within a given time frame. For example, a single session can contain multiple samples and transactions.
- A single user can run multiple sessions (iterations). As soon as one session ends, a new session is started after any configured session pacing. The session ends when one of the following conditions is satisfied:
- Inactivity time-out (default 1 minute)
- Maximum session duration (default 5 minutes)
- Maximum Pages in one session (default 100 pages)
These settings can be tuned by passing the following additional parameters:
-DcavSessionIdleTimeout=<idle time in seconds>
-DcavSessionMaxTime=<maximum time in seconds>
-DcavSessionMaxPages=<number of pages>
Analyze Results
Once the test starts, you can see the transaction summary in the bottom window, as shown in the following figure:
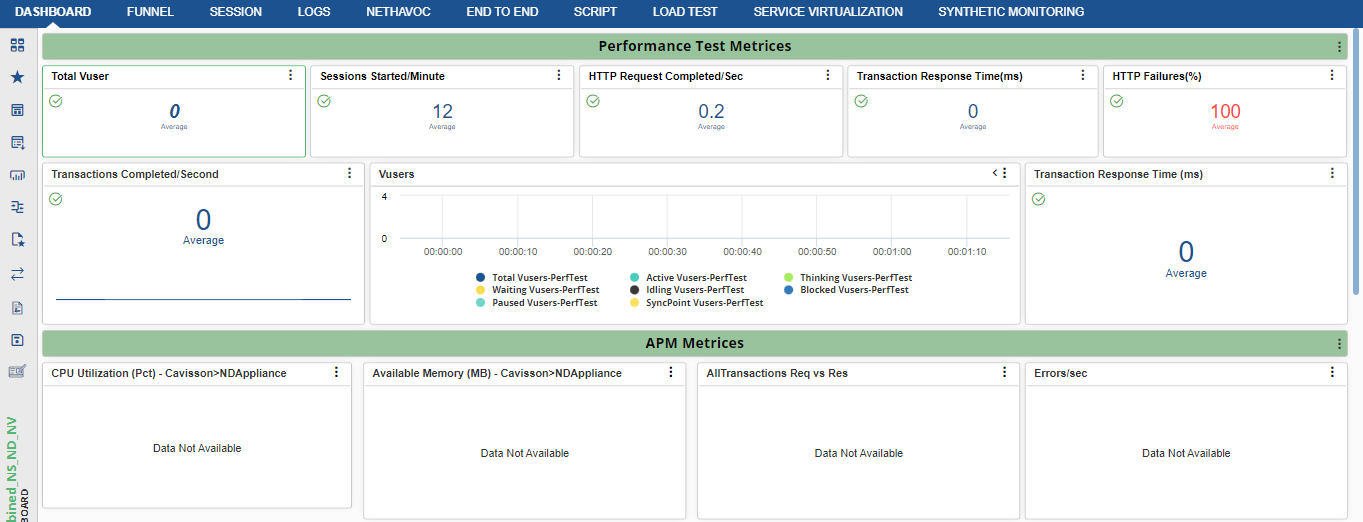
- You can also see the dashboard of different locations. You can easily get an insight into the location from where you observe high response time.
- Transaction Detail Report (View Transactions): Give screens of generator comparison.
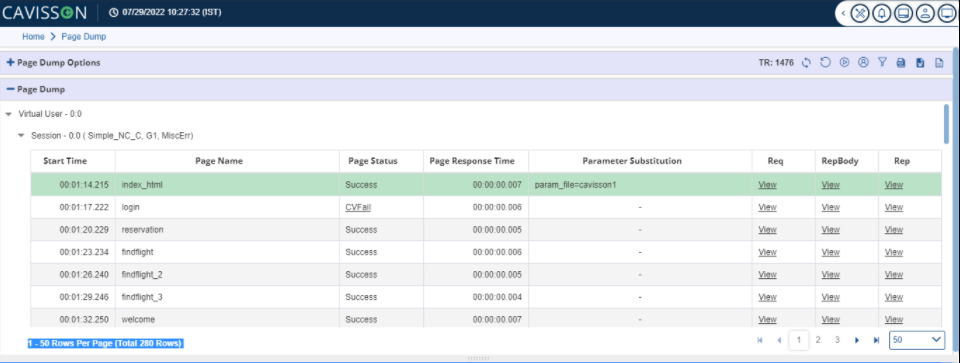
Open Page Dump
Click the icon to open the page dump report. You can look at the request and response for your HTTP sampler from here. Also, you can view all failures on this screen. In the example below, there was an Assertion Failure and it is marked as CVFail (content validation failure) here.
Drill Down
To view the drill-down reports, click. Here, you can view the available drill-down reports, such as:
- URL
- Session
- Transaction
- Page
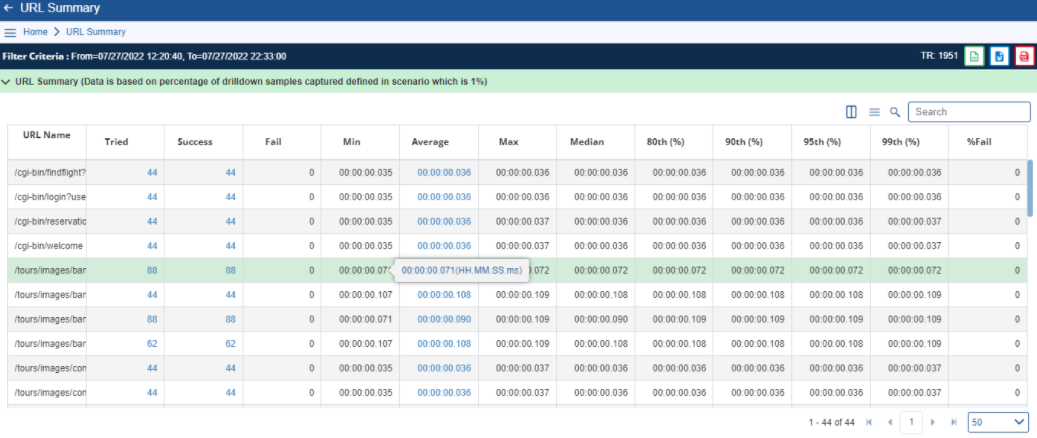
URL
This report displays URL summary, such as URL name, number of tries, number of successes, number of failures, minimum duration, average duration, maximum duration, median, 80th percentile, 90th percentile, 95th percentile, 99th percentile, percentage fail, and script count.
Further Reports in this Section
You can view further reports from this window by clicking the specified links.
- To view the URL instance report for tried attempts, click the Tried
- To view the URL instance report for successful attempts, click the Success
- To view the URL instance report for failed attempts, click the Fail
- To view URL Component details, click the Average
- To view URL Session Summary, click the Script Countlink.
Session
In JMeter, each thread executes all the sampler define in it, which is called a Session here. Netstorm completes a session of threads when the total duration exceeds 5 minutes or after 100 samples are executed, whichever happens first.
This report displays the Session summary, such as Script name, number of tries, number of successes, number of failures, minimum duration, average duration, maximum duration, median, 80th percentile, 90th percentile, 95th percentile, 99th percentile, and fail percentage.
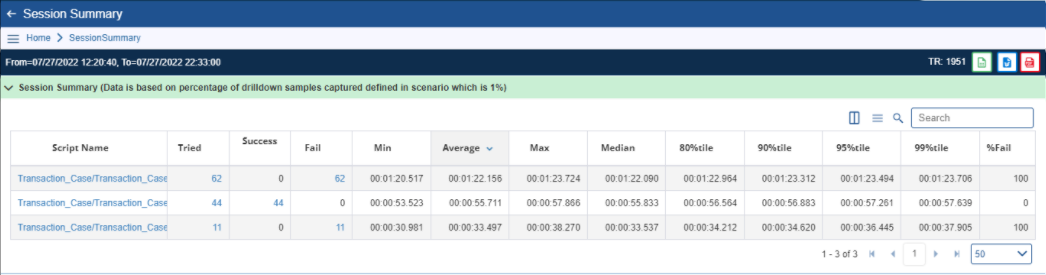
Further Reports in this Section
You can view further reports from this window by clicking the specified links.
- To view the script file in script manager, click the Script Name
- To view the Session instance report for tried attempts, click the Tried
- To view the Session instance report for successful attempts, click theSuccess
- To view the Session instance report for failed attempts, click theFail
- To view the Session details report, click the Average
Transaction
This report displays a Transaction summary, such as transaction name, minimum duration, average duration, maximum duration, median duration, 8th percentile, 90th percentile, 95th percentile, 99th percentile, script count, a number of tries, success, fails attempts, and fail percentage.
Further Reports in this Section
You can view further reports from this window by clicking the specified links.
- To view the Transaction details report, click the Average
- To view the Transaction session summary, click the Script Count
- To view the transaction instance for successful transactions, click the Tried
- To view the transaction instance for failed transactions, click the Fail
Page
You can also view the Page Summary report from the Drill Down Queries window. This window displays the following page summary details: Page name, number of tries, success, and failures. It also displays the minimum, maximum, average, and median duration of the page along with 80th percentile, 90th percentile, 95th percentile, 99th percentile, fails percentage, and script count.
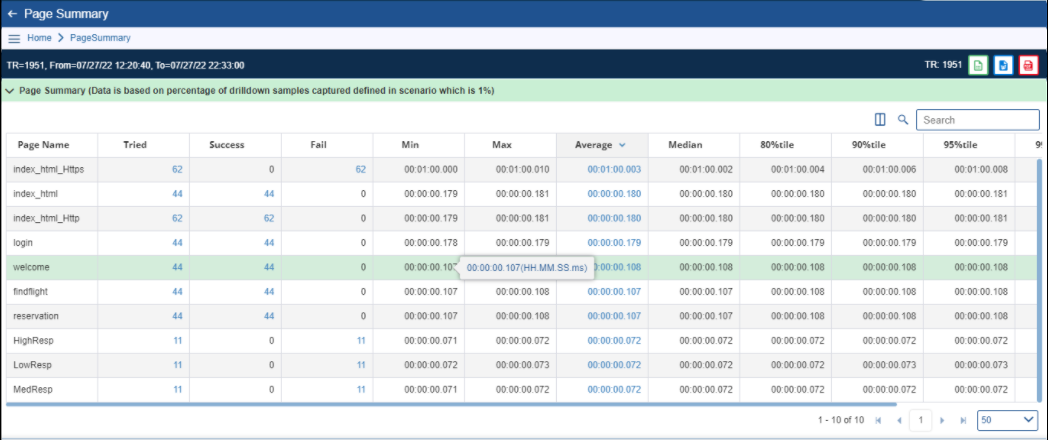
Other Reports from this Window
- To view the page instance report, click the Tried
- To view the page failure report, click the Fail
- To view the page component detail report, click the Average
- To view the page session summary report, click the Script Countlink.
Section A
You can override JMeter schedule settings like threads, test duration, and Ramp up by doing the following steps:
- Enable Override schedule settings.
- Since you will update this value through the command line, it must be defined in thread properties by writing $❴__P(threads,100)❵ for the number of threads, $❴__P(rampup,10)❵ for Ramp-Up Period, and $❴__P(duration,600)❵ for Duration.
If it is disabled, NetStorm will run with default values whatever is set in JMX. For example, here default value will be 100 for threads, 10 for ramp-up, and 600 for the duration.
Note: The values specified in the UI do not overwrite the actual values in your test plans. You should remove the hard-coded values in your script and replace them with the specified values to make sure these values are used.